General Information
These pages go over the steps required to used each of the Google Mapping Tool pages and features you can find throughout. This is broken down to 'General Information' for elements you will find through most page. Then their respected pages where it will go through the steps to perform the key task on the page and anything to note when performing said action.
The below image is a brief overview of the Google Map UI controllers:

Marker Model:
When on the Home and Batch pages a marker can be added by left clicking on the map. This will also add an entry within the ‘Marker Information’ table. If the marker is left clicked this will selected and open a popup modal containing the information of that marker.
Within this popup model the marker can be removed from the map by using the 'delete' button. Once viewing is no longer required the model can be closed using the top right cross button.

Zoom Level:
The zoom level can be manually adjusted using the slider on the top of the map view. Or using the device scroll feature while over the map view. This will keep the same level of zoom when selecting different markers/zones within the table and the map when centering onto that entry.
View All Markers/Zones:
This button depenidng on which page you are on, will adjust the map display and zoom level to allow all markers or zones to be shown within the map view.
Information Table:
The ‘Information’ table displays either marker or zone entries which have been placed on the map view. Again depends on which page you are on will determine which element is added. By clicking on a row entry this will center the map to the selected marker or the centroid of a zone.
If the entry is a marker then this will highlight the marker icon on the map green to show which marker is selected. In either case of it being a marker or zone entry, the map will center the map view onto the row element and highlight the row showing it has been selected.'
Any table entries which want to be removed can be done so by clicking on the bin icon button on that row. Which in turn will remove any markers or elements associated to thet entry.

Home Page
This page allows you to add individual markers using either of the following data types: Latitude/Longitude, Easting/Northing, Address or Three Words. Any number of markers can be added via the input methods or by simply clicking on the map view itself. This data can be exported once all markers have been add and if required.
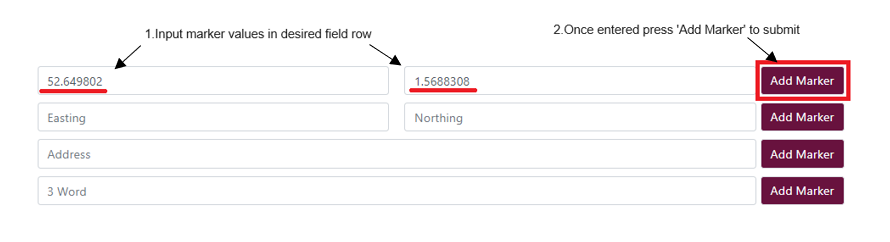
Step 1-2:
Using the position information of a desired unit which wants to be added. Input this information into one of the matching type fields on screen before pressing the ‘Add Marker’ button. This process looks similar to the following image below using latitude and longitude values as an example:
Once successfully added the unit will appear on the Google Map Viewer and Marker Information table. Similar to the image below:

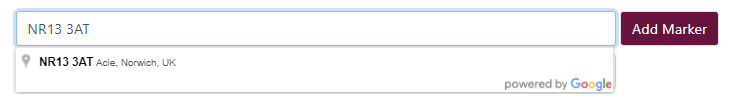
Note: The 'Address' input field uses the Google Map API to find the address as you search. Meaning this will try to auto complete as you type to try and find the wanted address, which you can select once it appears.
For the '3Words' input field this needs to be entered as a single line of text with no spaces but instead full stops in between each word.
An example of this is: barks.musically.atoms
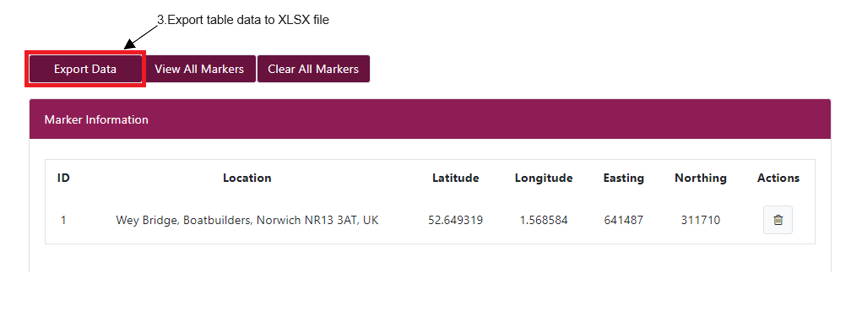
Step 3:
Once all the desired markers have been added, the whole of the 'Marker Information' table can be exported into an Excel file called ‘ETL_ExportMarkers’ using the ‘Export Data’ button. This is located at the bottom of the page above the ‘Marker Information’ table. This is shown in the image below:
Batch Page
The Batch page provides the ability to upload multiple entries from a single or multiple .CSV, .XLSM and .XLSX files. Once the files have been selected, along with the desired data type which the units would like to be used for uploading, for example the Easting\Northing values. The process will then place each unit using the defined Easting and Northing field header within the file and placing them on the Google Map Viewer and populating the rest of the unit’s information within the Marker Information table.
Step 1:
To start the upload process first click on the ‘Choose File’ button located at the top of the page. Or drag and drop the desired file/s ontop of the upload file area indicated within the image below.

Note: If using file explorer to pick files wanting to be uploaded then proceed to step 2-4. Otherwise after dragging and dropping the files and they are visable within the input field skip to step 5.
Step 2-4:
Once the file explorer window opens, navigate to the folder which has the files wanting to upload. Once there, by pressing and holding 'ctrl' before clicking on each file this will allow selecting of multiple before pressing ‘Open’ to complete this step.

Step 5:
After the files have been selected it will indicate how many have been selected or the name of the file if only one has been selected. Once all desired files have been selected, press ‘Submit’ to continue.
Note: The difference between the two is that 'Add' will place the position in the selected files aditional to any which have been previously added. Where as 'Add and Clear' will remove all previously added positions and then add the new positions within the selected files.
Step 6-7:
A popup modal will appear asking which data type would like to be used to process the data. Once one of these values has been selected then process ‘OK’ to continue.
Note:If there are no field headers or any which aren’t named as the selected data type value within all selected files then the process will error. There is a download template file link next to the submit button which can be used for uploading

Spread Page
The Spread page allows zones to be create by uploading a file which has markers position values with their associated zone name. Markers which has the same zone name will be grouped together and a polygon will be placed on the map viewer indecating the area of the zone. The markers within that zone will also be placed on the map viewer with the capability to hide or show any zones which want to be viewed. Once the zones has been mapped the ability to get the shortest route for that can be obtain by using the TSP (travel salesman problem) buttons. This will draw polylines on the map viewer using the Google Maps API to show what the route will look like. This information is stored once calculated for any or all zones which can then be viewed once exported.
Step 1:
Following similar steps as the batch page. First click on the ‘Choose File’ button located at the top of the page to start the process of uploading a spread file. Or drag and drop the desired file/s ontop of the upload file area indicated within the image below.
Note: If using file explorer to pick files wanting to be uploaded then proceed to step 2-4. Otherwise after dragging and dropping the files and they are visable within the input field skip to step 5.
Step 2-4:
Once the 'File/s Chosen' button has been pressed. Navigate to the folder which has the files wanting to upload. Once there, by pressing and holding shift before clicking on each file this will allow selecting of multiple before pressing ‘Open’ to complete this step. Double clicking on a file will automatically add the single file chosen.

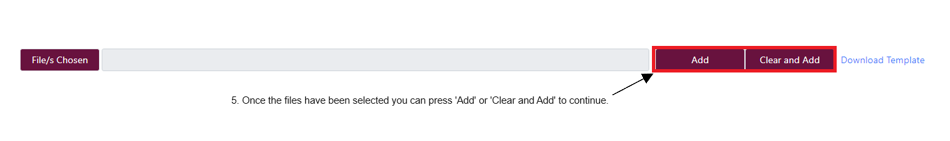
Step 5:
Once the files have been selected there are two options to pick from to submit the files. The difference between the two is that 'Add' will place the position in the selected files additional to any which have been previously added. Where as 'Clear and Add' will remove all previously added positions and then add the new positions within the selected files.
Note: The spread file must contain a header called ‘Zone’ which is the name of the zone a marker is in. Either or both Easting\Northing and Latitude\Longitude headers can be including but one pair needs to be present. An example of this is below:

A template download link is provided next to the submit buttons on this page if required.
After submitting it will process each entry and file then plot all the markers onto Google Maps Viewer. Each zone area is shown as a polygon containing all markers within and is indicated by a unique colour. Placing the zone details within the 'Zone Information' Table.

If the optimized route between all markers and zones want to be calculated, then the ‘Calculate TSP’ button is how this is done. Once this has completed processing polylines between the markers will show the link between each of the markers using Google Maps routing to calculate the travel distance between points. This can also be done on a per zone basis by clicking on the 'TSP' button on the desired row.
Step 6:
Once the files have been successfully uploaded the ‘Export Data’ button can be used to create an excel document containing this information.
Note: 'Export Data' will only be the table data which is exported and no calculated TSP data. Whereas 'Export Data with TSP' will include this data on another worksheet for any TSP data which has been generated.